posted: 23.09.2020 12:06
School
Data Analytics Basics
Jon Snow is not the only one who knows nothing. We know nothing as well. At least, not without data. Of course, we have to analyze data in order to give them meaning. Only after that, data becomes information. So, what should we do with the vast amounts of data generated by people, organizations and machines? The answer is data analytics.
Simply put, analytics is the systematic computational analysis of data or statistics. Nowadays, data analytics is an important tool to gain insight into business activities and to back decision-making process. Application of data analytics has evolved and developed over time. Not is provides numerous business benefits.
To present the development of analytics, we should set a time machine to the 19th century. That is when Frederick Winslow Taylor contemplated on scientific management and methods. Henry Ford was also one of the pioneers in data analytics as he kept a record on the speed of assembly lines.
Analytics gained importance in the early ’70es when we started using computers in decision-making. Development of Big Data, Data Warehouses and Cloud Computing had a massive impact on research, discovery and interpretation of data. Modern organizations are investing heavily in data analytics as companies need swift and agile decision process to retain its market position and competitiveness.
The following text explains, in short, the process and types of data analytics.
How to data analytics
#1 Collect the requests
The cornerstone in a data analytics process is to ask yourself why do you want to analyze that specific data in the first place. You will define your goal and purpose of the analytics and decide what type of analytics you are going to use. According to this, you’ll make a plan of action.
#2 Collect data
After you gather all the requests, it’s time to gather data. You will reach out to various sources so you might want to have them listed with the collection date and comment that might help you later put the findings in context.
#3 Filter data
Not all data that has been collected is useful for your analysis, so clear all unnecessary ones. The more precise data is, the more accurate result will be. You might come across the term GIGO (Garbage In-Garbage Out), meaning low-quality inputs will produce low-quality results.
#4 Analyze data
Ones you gathered, cleared, and processed data, it’s time to analyze. You’ll utilize data to discover wanted information. Sometime, you will have to dig deeper and extend a set of data. In this phase, you will use a different approach to finish the process successfully.
#5 Construe data
After analytics, you’ll need to interpret your findings. We recommend simple text, tables and charts.
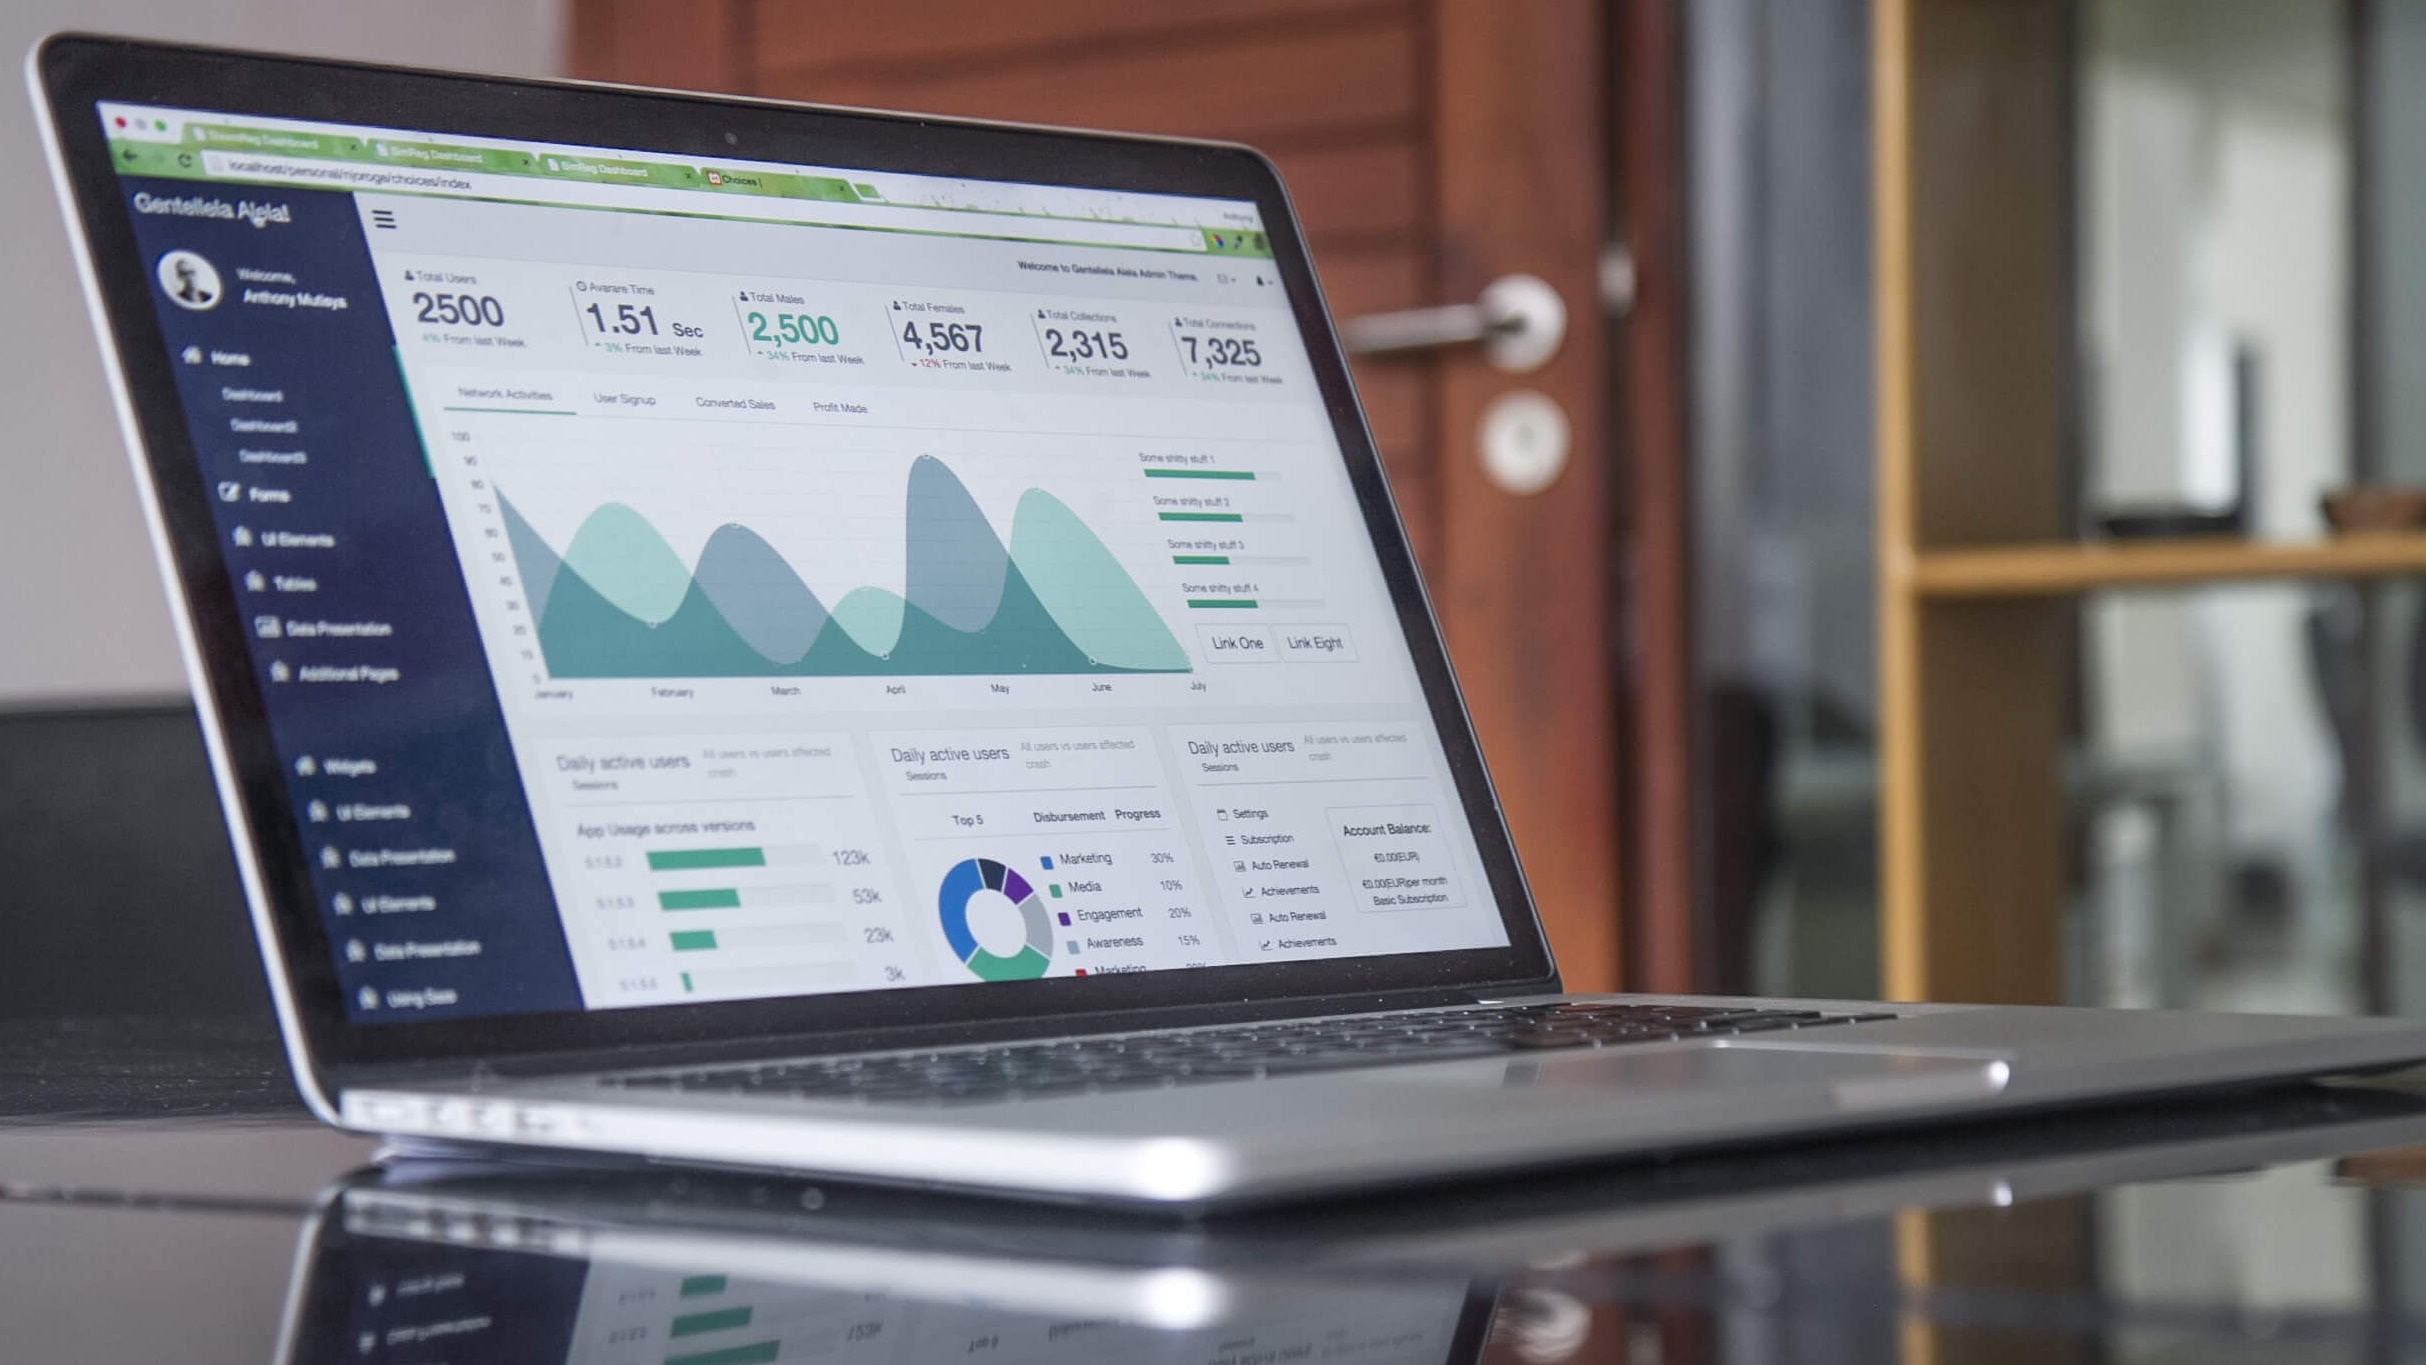
#6 Visualize it
Nowadays, the visualization of data is omnipresent. Graph presentation of data is easier to understand and process. By looking at different connections and comparing different sets of data, people can easily discover the meaning of information.
Types of data analytics
#1 Descriptive analytics – What happened?
This type of analytics uses simple methodology and statistics which describes one variable and its distribution.
#2 Predictive analytics – What is going to happen?
This analytics foresees the usage of sophisticated analytic methods. The main objective is to predict a future outcome based on historical data. You can predict the value of some phenomenons, relations strength, trends, patterns and exceptions.
#3 Diagnostic analytics – Why did something happen?
This analytics type will answer a why question. It gives insight into a particular problem.
#4 Prescriptive analytics – What to do to achieve the desired outcome?
This analytics will give you a potential solution for the problem based on previous similar situations. It uses information collected by using descriptive and predictive analytics.
Application of analytics
Client or buyer is an essential stakeholder in many businesses. If you have failed in creating a quality clients base, your business might be in jeopardy. Data analytics is used to acquire and retain customers. In the year 2015, Coca-Cola managed to strengthen its data strategy by introducing a digital loyalty program.
Data analytics will assist in the process of business operation transition. This includes the possibility to adjust to the buyers’ expectations, changes in product, and marketing campaign efficiency. Netflix is a fabulous example of data analytics use for target advertising. Application of data analytics in risk management is significant as well as in innovation, product development and many other business processes.
According to the World Economic Forum, 85% of world companies are using analytics and related technologies in their business with the tendency to reach 96% in the next two years. This trend will also generate additional demands for a qualified workforce.
You can get familiar with the basics of data analytics in our SPARK School. Once a year, we organize a Data Analytics workshop with the primary goal to introduce this vocation and its importance for the ever-changing business ecosystem.

